Create bar graphs
key notes:-
1️⃣ What is a Bar Graph?
- A bar graph is a picture that shows information using bars.
- Each bar represents a number or quantity.
- Bars can be vertical (up and down) or horizontal (side to side).
- Example: 📚🍎⚽🎵
2️⃣ Parts of a Bar Graph
- Title 🏷️ – tells what the graph is about.
- X-axis ➡️ – shows the categories (e.g., fruits, sports).
- Y-axis ⬆️ – shows the numbers or quantity.
- Bars ▇ – represent the information. Taller bars mean more, shorter bars mean less.
3️⃣ Steps to Create a Bar Graph
- Collect data 📋 – write down what you want to show.
- Choose categories 🏷️ – what each bar will represent.
- Draw axes ➡️⬆️ – label X-axis and Y-axis.
- Mark the numbers on Y-axis 🔢 – use equal intervals.
- Draw bars ▇ – make each bar the right height for the data.
- Give a title 🏷️ – name your graph clearly.
4️⃣ Tips for Bar Graphs
- Use different colors 🌈 for each bar to make it easy to read.
- Make sure the bars are equal in width and evenly spaced.
- Start Y-axis at 0 for accurate comparison.
- Label everything clearly ✏️.
5️⃣ Fun Example
Suppose you counted your friends’ favorite fruits:
- 🍎 Apple – 5
- 🍌 Banana – 3
- 🍇 Grapes – 4
Your bar graph will have:
- X-axis: Apple, Banana, Grapes
- Y-axis: 0, 1, 2, 3, 4, 5
- Bars with different colors showing the numbers
Learn with an example
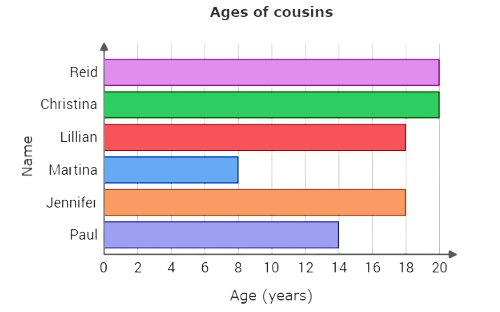
1) Reid is 20 years old, Christina is 20 years old, Lillian is 18 years old, Martina is 8 years old, Jennifer is 18 years old and Paul is 14 years old.
Use this data to complete the bar graph below.
Click to set the length of the missing bar.
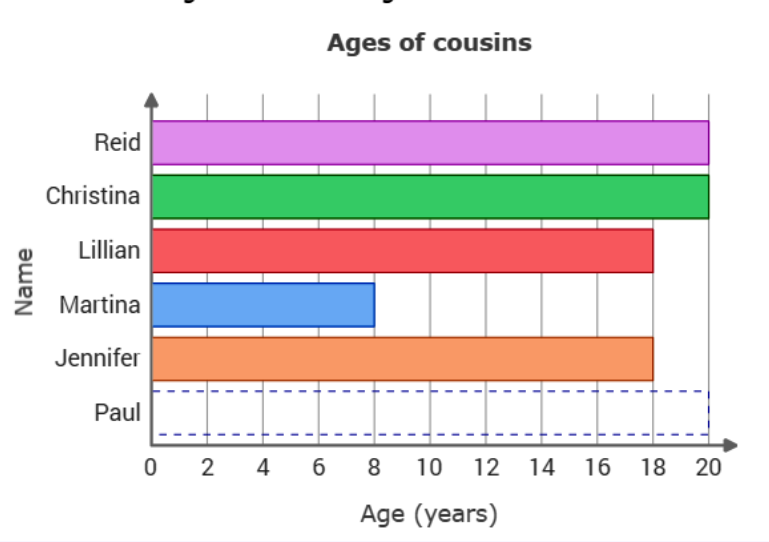
- The missing bar is for Paul. Set the length of the missing bar to 14.
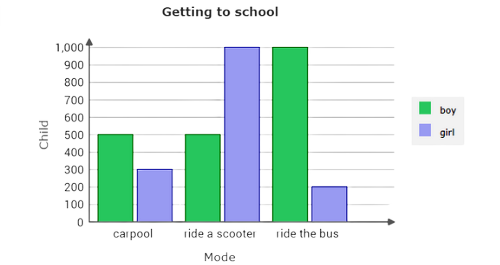
2) During Environmental Week, the Cheema School District surveyed students to find out whether they rode the bus, biked, walked, carpooled, or rode a scooter to school.
Use the data in the table to complete the bar graph below.
| Getting to school | ||
|---|---|---|
| Mode | Boy | Girl |
| carpool | 500 | 300 |
| ride a scooter | 500 | 1,000 |
| ride the bus | 1,000 | 200 |
Click to set the height of the missing bar.

- In the table, find the carpool row. Find the number in the boy column. 500 boys carpool to school. Set the height of the missing bar to 500.
3) Ashland has 1 school, Columbia has 5 schools and Watertown has 3 schools.
Use this data to complete the bar graph below.
Click to set the height of the missing bar.

- The missing bar is for Columbia. Set the height of the missing bar to 5.

Let’s practice!🖊️

