Interpret line plots
key notes:
📈 What is a Line Plot?
- A line plot is a graph that shows data along a number line using X marks (✖) to represent how many times each value occurs.
- Example: How many students scored each mark in a test.
🔢 Number Line
- The horizontal line is called the number line.
- Numbers on the line represent the possible values of the data.
- Make sure the numbers are evenly spaced.
✖ X Marks
- Each ✖ represents one occurrence of a data value.
- More ✖ means more students/items with that value.
📊 Reading the Line Plot
- Look at a number on the line: count the X marks above it to know how many times it happened.
- Example: 5✖ above number 7 means 7 appeared 5 times.
💡 Key Questions to Ask
- Which value occurs most often? (Mode)
- Which value occurs least often?
- How many items are in total?
- Are there any missing numbers?
📐 Using Fractions or Smaller Units
- Sometimes, line plots show fractions or halves.
- Example: 1/2 inch, 1/4 inch – each ✖ still represents one measurement.
📊 Benefits of Line Plots
- Helps us see patterns easily.
- Makes comparing data simple.
- Helps answer questions quickly.
🎨 Tips for Students
- Label your number line clearly.
- Use different colors for X marks if needed.
- Count carefully before drawing or interpreting X marks.
Learn with an example
1) Some students shared how many toy cars they have.

How many students in the class have exactly 2 toy cars?
____ students
- Count all the X’s in the column for 2 toy cars. 2 students have exactly 2 toy cars.
2) For a project, Michael found out how often people played miniature golf last summer.
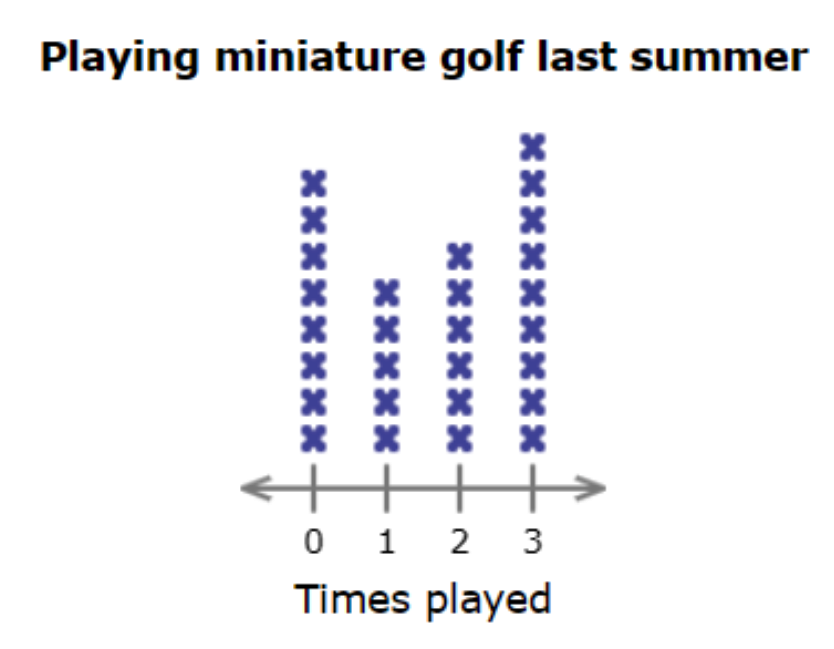
How many people are there in all?
____ people
- Count all the X’s in the line plot. There are 28 X’s. There are 28 people in all.
3) The readers of a magazine reported how many winter hats they owned.

How many readers have more than 1 hat?
_____ readers
- Count all the X’s in the columns for 2 or 3 hats. There are 14 X’s. 14 readers have more than 1 hat.
Let’s practice!🖊️