Create line plots
key notes:
What is a Line Plot?
- A line plot is a simple graph that shows data along a number line.
- Each X (✖️) above a number shows how many times that number occurs.
- Example: 🎲 Rolling a dice 10 times and counting results.
Steps to Create a Line Plot:
- Collect data 📝 – Record the numbers or measurements.
- Draw a number line ➖ – Include all numbers in your data.
- Mark the data ❌ – Put an X above the number for each time it occurs.
- Title your graph 🏷️ – Give it a name that tells what the data is about.
Why Use Line Plots?
Easy to see patterns and compare data 📈.
Helps answer questions like:
- “Which number happened the most?” 🤔
- “How many times did a number appear?” 🔢
Tips for Line Plots:
- Make sure the number line is clear ➡️ evenly spaced numbers.
- Use X’s or dots consistently ✅.
- Count carefully – each X = 1 occurrence 🧮.
Vocabulary to Remember:
- Data 📊 – Information we collect.
- Number Line ➖ – Shows the numbers.
- Frequency 🔢 – How many times a number appears.
- Line Plot 📈 – Graph showing frequency of data.
Learn with an example
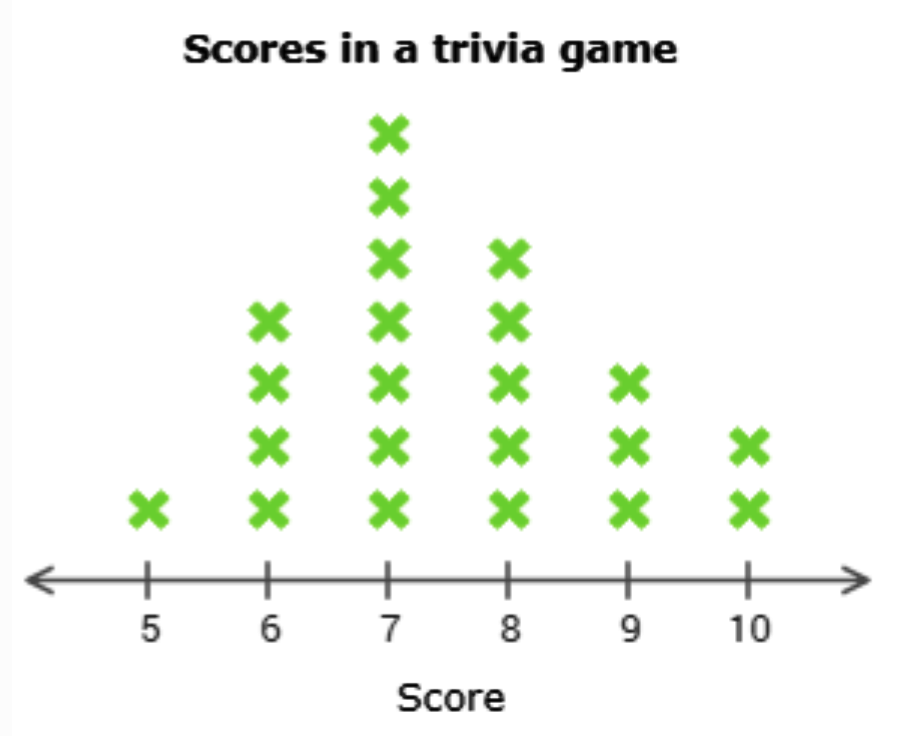
1) A group of people played a trivia game.
Use the data in the table to complete the line plot below.
| Scores in a trivia game | |
|---|---|
| Score | Number of people |
| 5 | 1 |
| 6 | 4 |
| 7 | 7 |
| 8 | 5 |
| 9 | 3 |
| 10 | 2 |
Click to select the X’s. To clear a column, click on the number line below it.
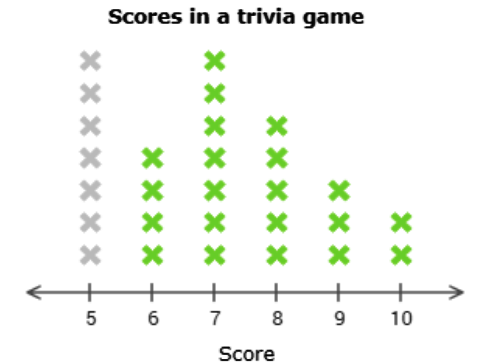
- The first missing piece of data is for 5. Find the row for 5 in the table. 1 person scored 5. Select 1 X in the column above 5.
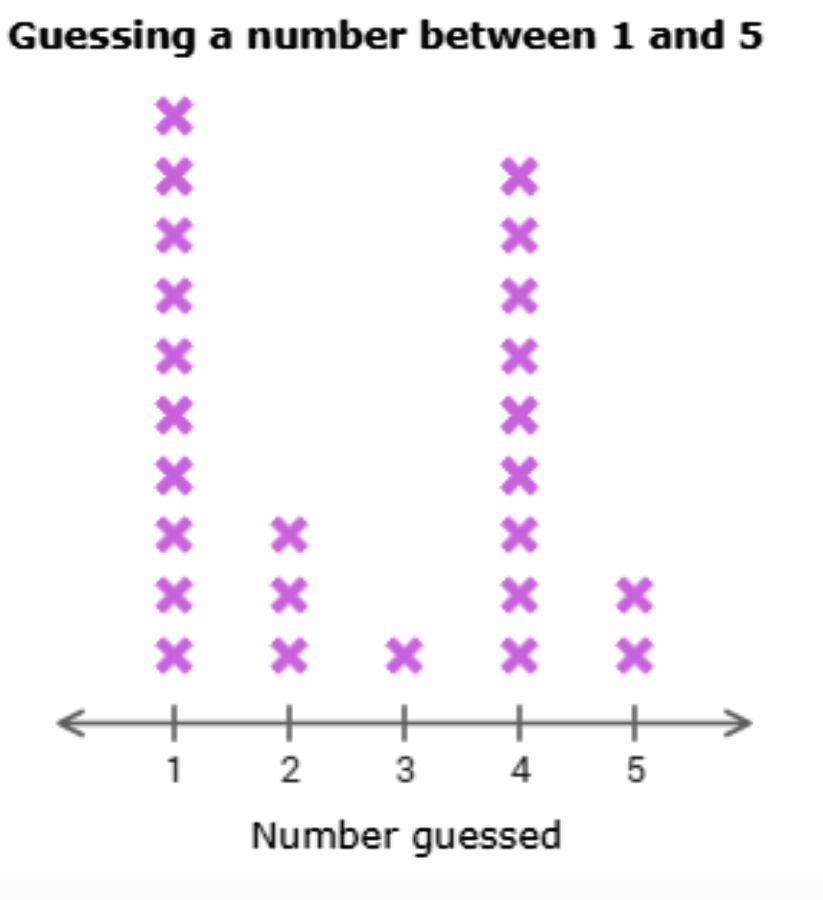
2) Students in Mrs. Seth’s maths class guessed a number between 1 and 5 and recorded the results.
Use the data in the tally chart to complete the line plot below.
| Guessing a number between 1 and 5 | |
|---|---|
| Number guessed | Number of students |
| 1 |  |
| 2 |  |
| 3 |  |
| 4 |  |
| 5 |  |
Click to select the Xs. To clear a column, click on the number line below it.
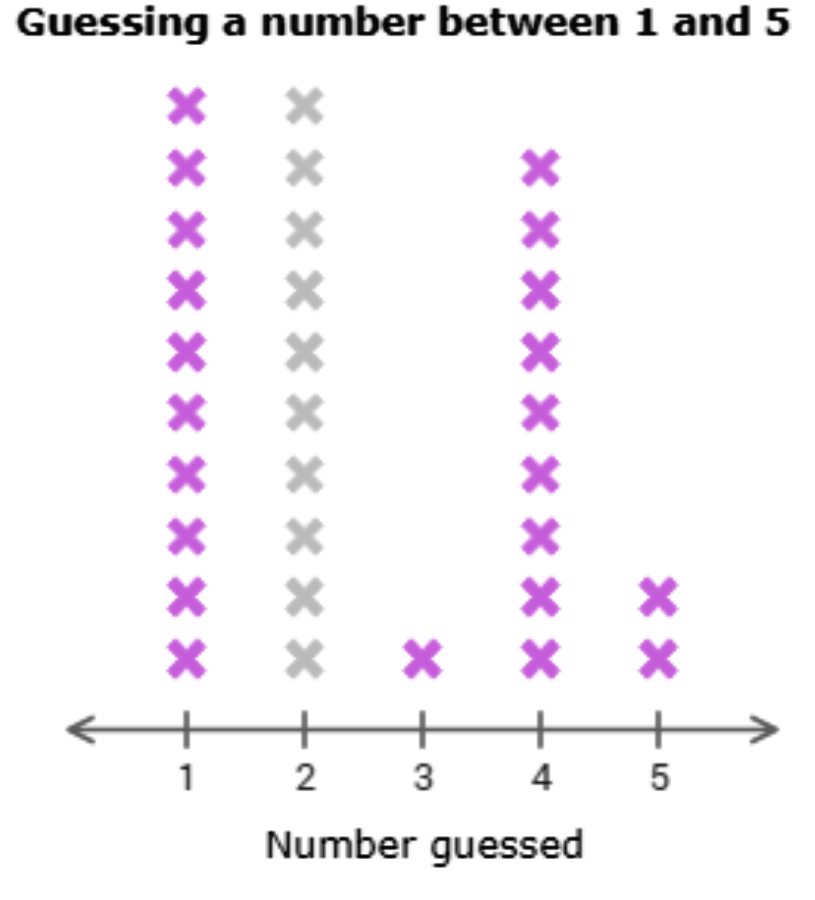
- The first missing piece of data is for 2. Find the row for 2 in the table, and count the tally marks. 3 students guessed 2. Select 3 X’s in the column above 2.
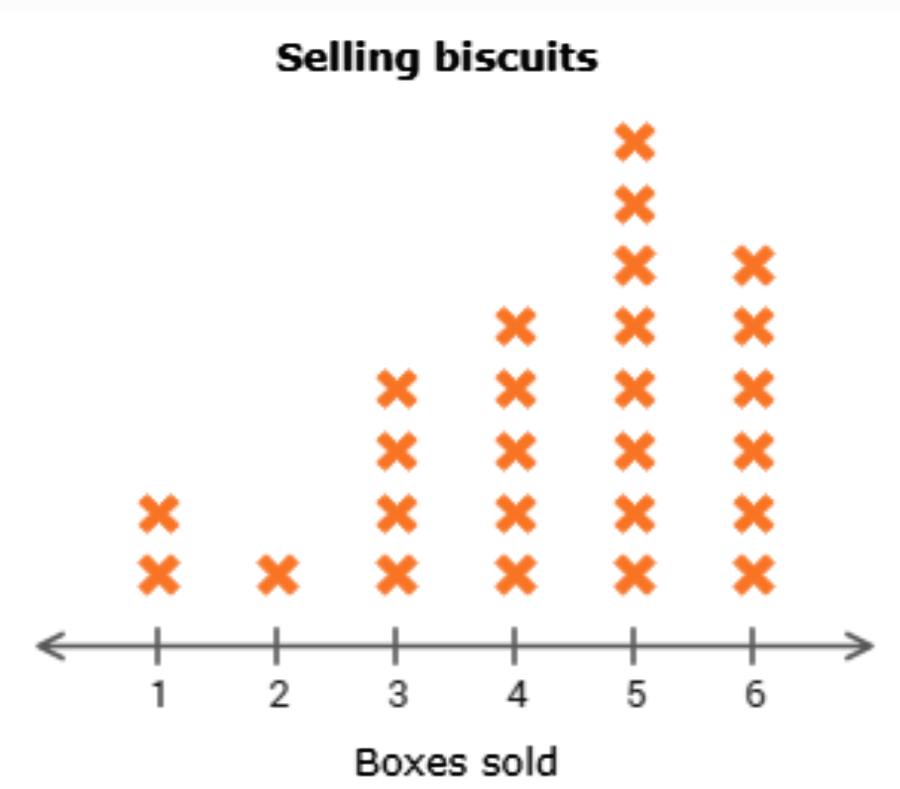
3)Some students sold biscuits for a fundraiser.
Use the data in the table to complete the line plot below.
| Selling biscuits | |
|---|---|
| Boxes sold | Number of students |
| 1 | 2 |
| 2 | 1 |
| 3 | 4 |
| 4 | 5 |
| 5 | 8 |
| 6 | 6 |
Click to select the X’s. To clear a column, click on the number line below it.
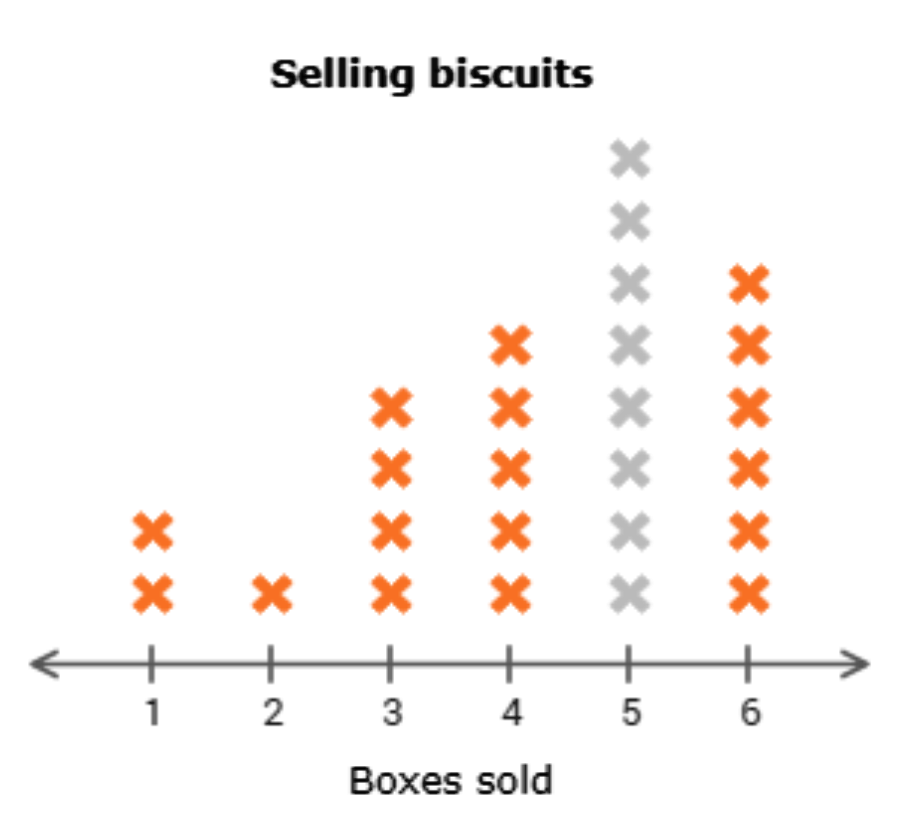
- The first missing piece of data is for 5. Find the row for 5 in the table. 8 students sold exactly 5 boxes of biscuits. Select 8 X’s in the column above 5.
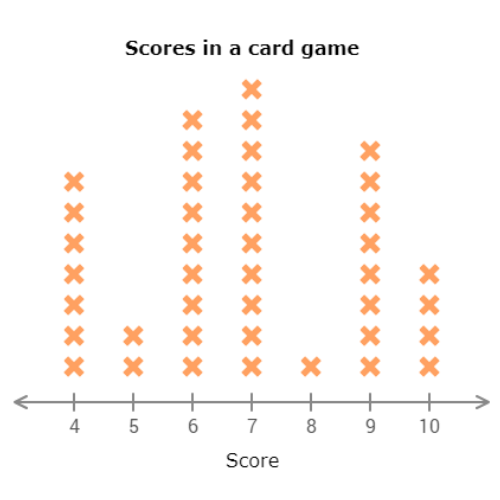
4)Eliza figured out the scores at the end of a card game.
Use the data in the tally chart to complete the line plot below.
| Scores in a card game | |
|---|---|
| Score | Number of people |
| 4 | |
| 5 | |
| 6 | |
| 7 | |
| 8 | |
| 9 | |
| 10 | |
Click to select the X’s. To clear a column, click on the number line below it.
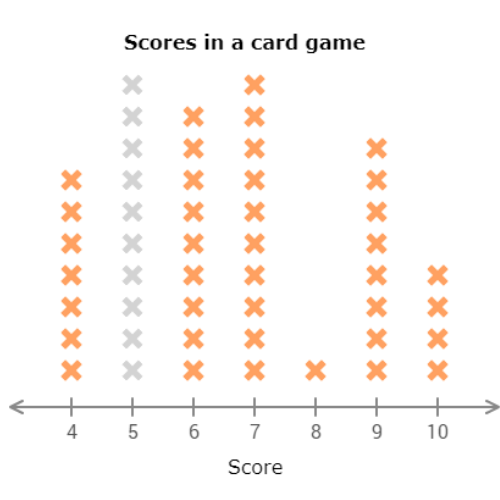
The first missing piece of data is for 5. Find the row for 5 in the table, and count the tally marks. 2 people scored 5. Select 2 X’s in the column above 5.
Let’s practice!🖊️

